首发于 微信公众号 Mumu的小宇宙 2025.08.13
20250812,李笑来在其微博发文自己创建了一个新的Github仓库:

第二天,打算试一下,发现博文中的仓库已经没了,出了一个新版:https://github.com/xiaolai/sp500-minimal-L,于是我第一时间试用了一下并进行了迭代。
这个仓库的代码主要做两件事:
- 找出投资多少年才能保证不亏钱\
从基准时间开始计算,任意一年买入并持有,最少多少年是正收益。\
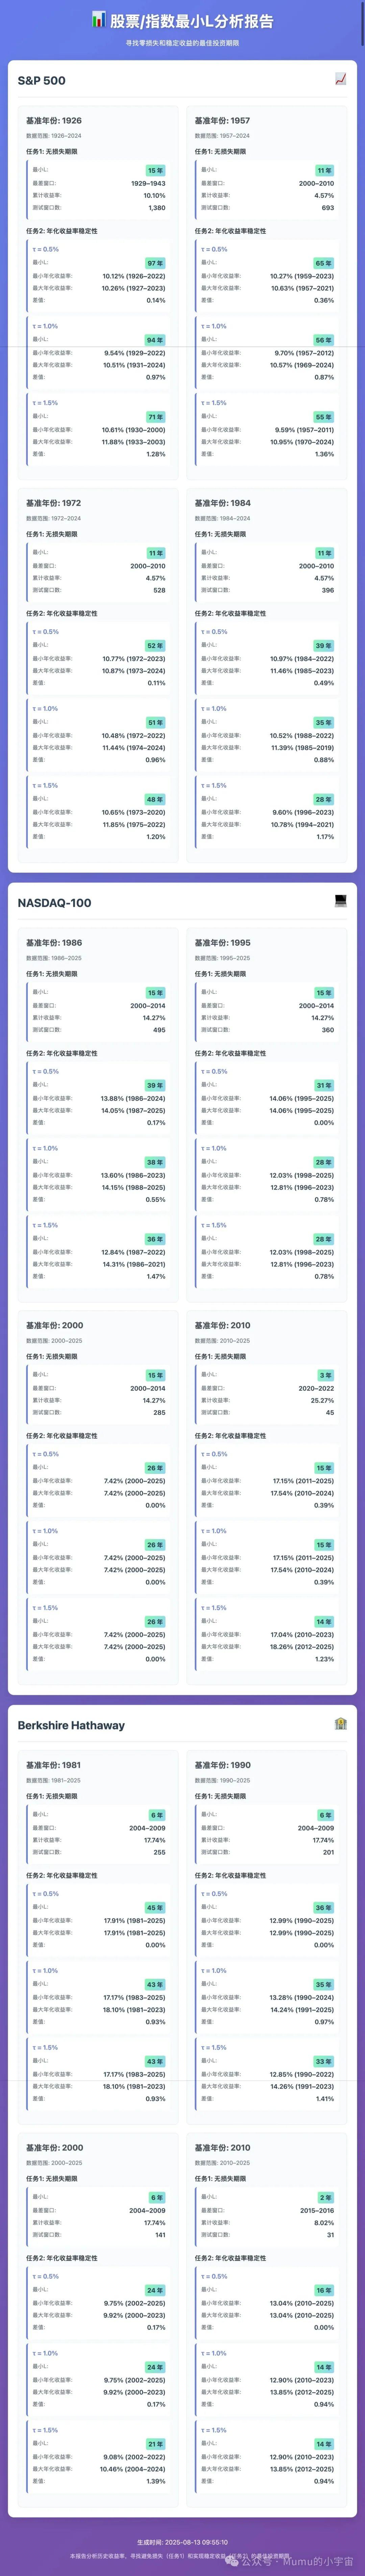
比如下面的运行效果,从1926年开始统计,最少15年,可获得正收益;\
从1957年开始统计,最少11年,可获得正收益。 - 找出投资多少年才能让年化收益率变得稳定可预测\
从基准时间开始计算,如果你投资达多少年,不管从哪年开始,年化收益率都会满足设定的波动,变得稳定。\
比如下面的运行结果,从1926年开始统计,如果你投资达97年,不管从哪年开始,年化收益率最差和最好相差小于0.5%;\
从1984年开始统计,如果你投资达39年,不管从哪年开始,年化收益率最差和最好相差小于0.5%。
从统计结果看,买入不亏钱和收益变得稳定需要的年份都在变得越来越短。
运行效果如下:
Trying to load local history.csv...
Loading CSV from history.csv...
No 'Year' column found, trying as headless CSV...
S&P 500 annual returns — CSV data analysis (nominal)
Source: CSV file (local or remote)

Baseline 1926
- Data span used: 1926–2024
- Chosen column: Return (%)
Task 1 (no-loss horizon): minimal L = 15; worst window 1929–1943; CumRet = 10.10%; windows tested = 1380
Task 2 (τ = 0.5%): minimal L = 97; min 1926–2022 (CAGR 10.12%); max 1927–2023 (CAGR 10.26%); spread 0.14%; windows tested = 4947
Task 2 (τ = 1.0%): minimal L = 94; min 1929–2022 (CAGR 9.54%); max 1931–2024 (CAGR 10.51%); spread 0.97%; windows tested = 4935
Task 2 (τ = 1.5%): minimal L = 71; min 1930–2000 (CAGR 10.61%); max 1933–2003 (CAGR 11.88%); spread 1.28%; windows tested = 4544

Baseline 1957
- Data span used: 1957–2024
- Chosen column: Return (%)
Task 1 (no-loss horizon): minimal L = 11; worst window 2000–2010; CumRet = 4.57%; windows tested = 693
Task 2 (τ = 0.5%): minimal L = 65; min 1959–2023 (CAGR 10.27%); max 1957–2021 (CAGR 10.63%); spread 0.36%; windows tested = 2340
Task 2 (τ = 1.0%): minimal L = 56; min 1957–2012 (CAGR 9.70%); max 1969–2024 (CAGR 10.57%); spread 0.87%; windows tested = 2268
Task 2 (τ = 1.5%): minimal L = 55; min 1957–2011 (CAGR 9.59%); max 1970–2024 (CAGR 10.95%); spread 1.36%; windows tested = 2255

Baseline 1972
- Data span used: 1972–2024
- Chosen column: Return (%)
Task 1 (no-loss horizon): minimal L = 11; worst window 2000–2010; CumRet = 4.57%; windows tested = 528
Task 2 (τ = 0.5%): minimal L = 52; min 1972–2023 (CAGR 10.77%); max 1973–2024 (CAGR 10.87%); spread 0.11%; windows tested = 1430
Task 2 (τ = 1.0%): minimal L = 51; min 1972–2022 (CAGR 10.48%); max 1974–2024 (CAGR 11.44%); spread 0.96%; windows tested = 1428
Task 2 (τ = 1.5%): minimal L = 48; min 1973–2020 (CAGR 10.65%); max 1975–2022 (CAGR 11.85%); spread 1.20%; windows tested = 1416

Baseline 1984
- Data span used: 1984–2024
- Chosen column: Return (%)
Task 1 (no-loss horizon): minimal L = 11; worst window 2000–2010; CumRet = 4.57%; windows tested = 396
Task 2 (τ = 0.5%): minimal L = 39; min 1984–2022 (CAGR 10.97%); max 1985–2023 (CAGR 11.46%); spread 0.49%; windows tested = 858
Task 2 (τ = 1.0%): minimal L = 35; min 1988–2022 (CAGR 10.52%); max 1985–2019 (CAGR 11.39%); spread 0.88%; windows tested = 840
Task 2 (τ = 1.5%): minimal L = 28; min 1996–2023 (CAGR 9.60%); max 1994–2021 (CAGR 10.78%); spread 1.17%; windows tested = 770
我基于此代码做了主要如下的迭代:
- 添加纳斯达克100和伯克希尔哈撒韦的数据;
- 运行后生成阅读友好的网页报告;
- 汉化输出内容。
网页报告结果如下:
如果大家想自己运行获得结果,请访问Github仓库:https://github.com/vwumumu/stocks-minimal-L
可以运行试试看,有小彩蛋~,也可以加入Mumu的小宇宙社群,了解小彩蛋。

0
times bought
•
0
times reward
0.0
Price(BTC)
0
Paid Times
$0.0
Revenue
0.0%
My Share(%)


@37351541
Joined at March 16, 2021
MixChat开发者;
《最少必要编程课——从学到用》作者;
《小白慢爬营》资深同学;
未完待续...
Related Posts
 深度解析《投资多久必赚钱?》中的两个任务
您到底需要多少钱?
如何提前检验最低财富自由的生活?
冯晓东——Mixin Network 被黑及开发情况说明(文字版)
将Mixin交易记录保存到本地
深度解析《投资多久必赚钱?》中的两个任务
您到底需要多少钱?
如何提前检验最低财富自由的生活?
冯晓东——Mixin Network 被黑及开发情况说明(文字版)
将Mixin交易记录保存到本地